Join Examsbook
यदि जारी किए गए वीज़ाओं में से 10 % वीज़ा धारक वीज़ा का उपयोग नहीं करते हैं , तो 2011 से 2016 तक कितने लोगों ने वीज़ा का उपयोग किया है ?
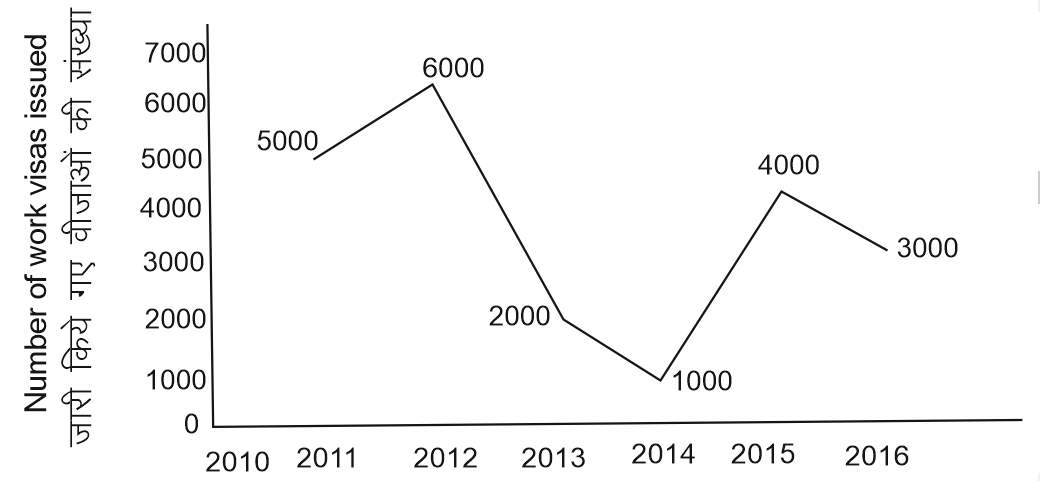
5Directions: The line graph shows the number of work visas issued by a country in each year from 2011 to 2016. Study the diagram and answer the following questions .
Q:
यदि जारी किए गए वीज़ाओं में से 10 % वीज़ा धारक वीज़ा का उपयोग नहीं करते हैं , तो 2011 से 2016 तक कितने लोगों ने वीज़ा का उपयोग किया है ?
- 119800false
- 27800false
- 318700false
- 418900true
- Show AnswerHide Answer
- Workspace