Join Examsbook
वर्ष 2011 में हुआ चावल का उत्पादन वर्ष 2010 में हुए चावल के उत्पादन का कितना प्रतिशत है ?
5Directions: The bar graph given below shows the production (in ' 000 tones) of rice of a country for the year 2007 to 2011. Study the graph carefully and answer the question given below it. 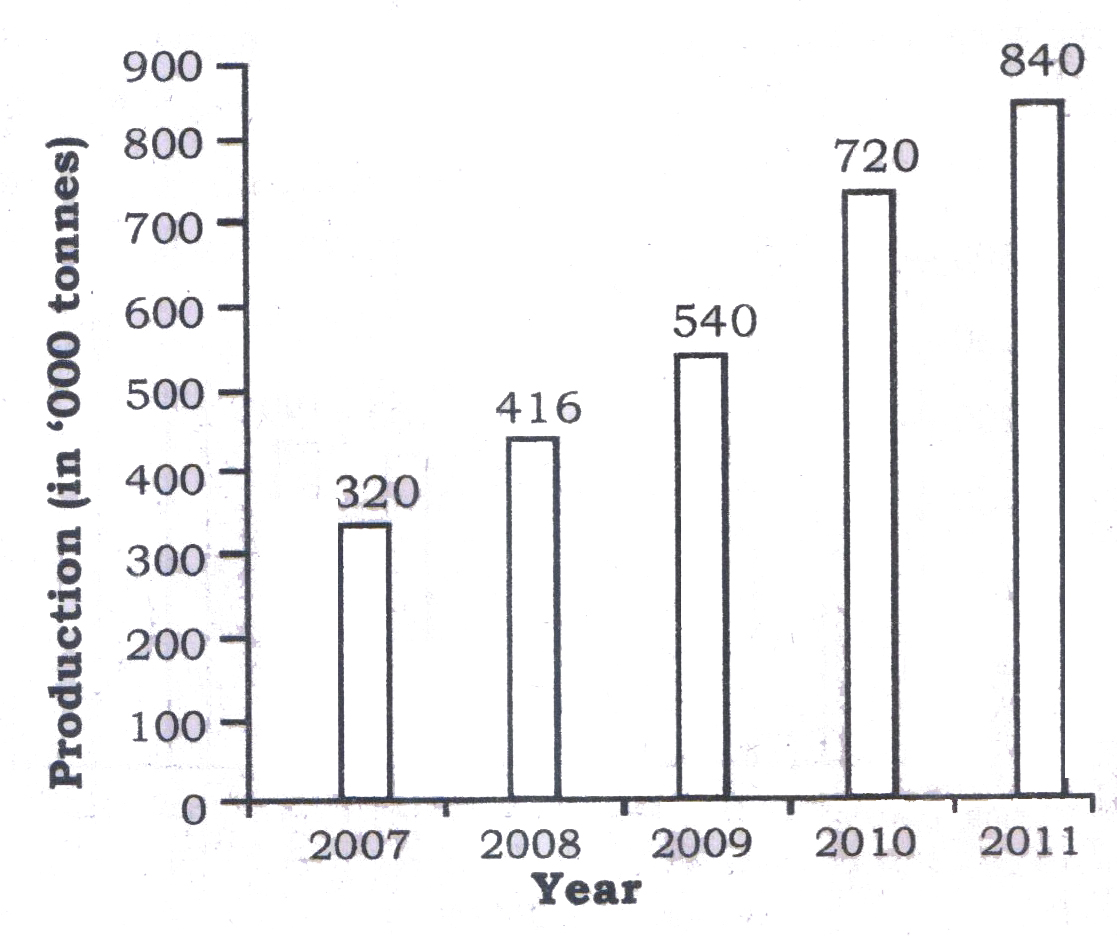
Q:
वर्ष 2011 में हुआ चावल का उत्पादन वर्ष 2010 में हुए चावल के उत्पादन का कितना प्रतिशत है ?
- 1116.66true
- 2121.5false
- 3133.33false
- 4108.5false
- Show AnswerHide Answer
- Workspace