Join Examsbook
चॉकलेट पसंद करने वालों के लिए वेनिला पसंद करने वाले बच्चों का अनुपात है:
5Direction: Study the following diagram and answer question based on it-
The diagram represents the favourite ice-cream flavours of kids in a society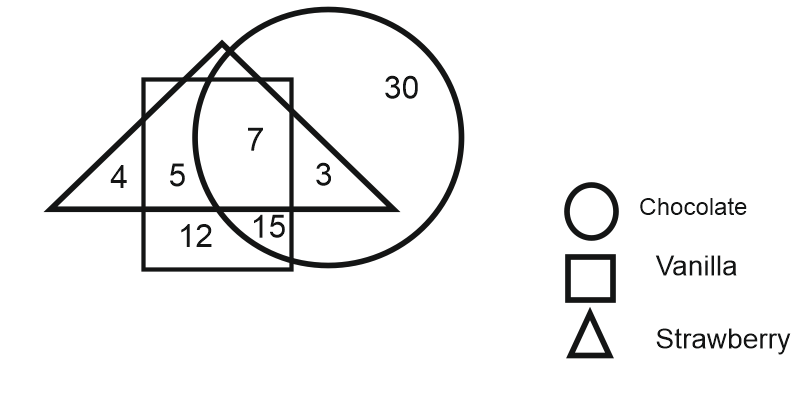
Q:
चॉकलेट पसंद करने वालों के लिए वेनिला पसंद करने वाले बच्चों का अनुपात है:
- 1$$ {12\over30 }$$false
- 2$$ {39\over45 }$$false
- 3$$ {27\over45 }$$false
- 4$$ {39\over55 }$$true
- Show AnswerHide Answer
- Workspace
Answer : 4. "$$ {39\over55 }$$"
Similar Questions
Since Nithya and Suganya exchange places, so Rita’s new position is the same as Monika’s earlier position. This position is 17th from the right and 10th from the left. Therefore Number of girls in the row = (16 + 1 + 9) = 26.