Join Examsbook
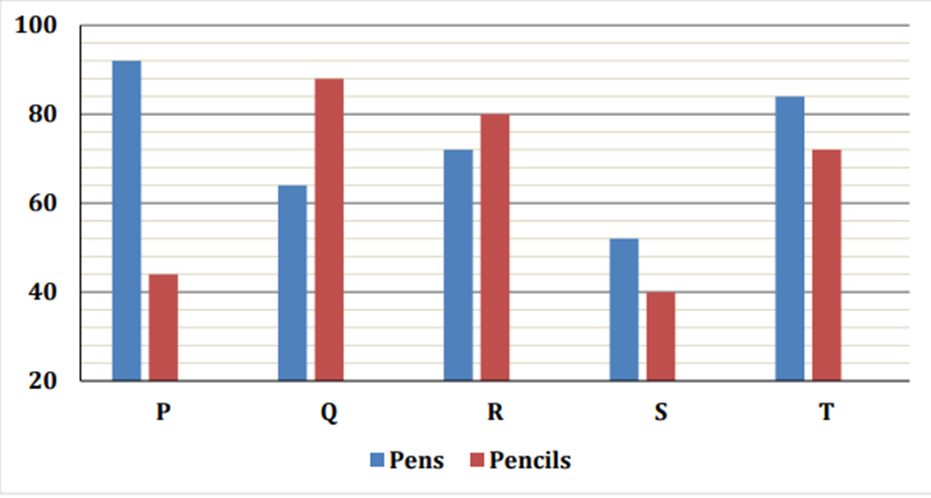
R द्वारा बेचे गए पेन और पेंसिल की कुल संख्या, T द्वारा बेचे गए पेन और पेंसिल की कुल संख्या से लगभग कितने प्रतिशत अधिक या कम है?
5Direction: Bar graph given below shows number of pens and pencils sold by five different shops. Read the data carefully and answer the questions.
Q:
R द्वारा बेचे गए पेन और पेंसिल की कुल संख्या, T द्वारा बेचे गए पेन और पेंसिल की कुल संख्या से लगभग कितने प्रतिशत अधिक या कम है?
- 15%false
- 23%true
- 37%false
- 41%false
- 59%false
- Show AnswerHide Answer
- Workspace