Join Examsbook
वर्ष 1994 से 1998 तक बिक्री में प्रति वार्षिक औसतन बढोतरी क्या थी (करोङो में)।
5Directions: The following graph gives Sales, Expense and Capital of a company for a period of five years 1994 to 1998. Read the graph and answer the following questions.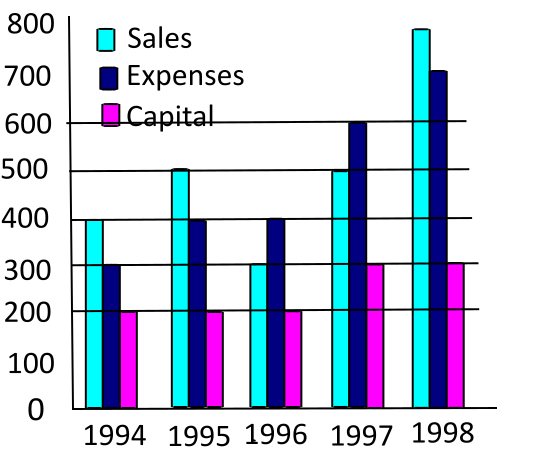
Q:
वर्ष 1994 से 1998 तक बिक्री में प्रति वार्षिक औसतन बढोतरी क्या थी (करोङो में)।
- 150false
- 260false
- 380true
- 4100false
- Show AnswerHide Answer
- Workspace