Join Examsbook
परिवार का अधिकतम खर्चा चालू था
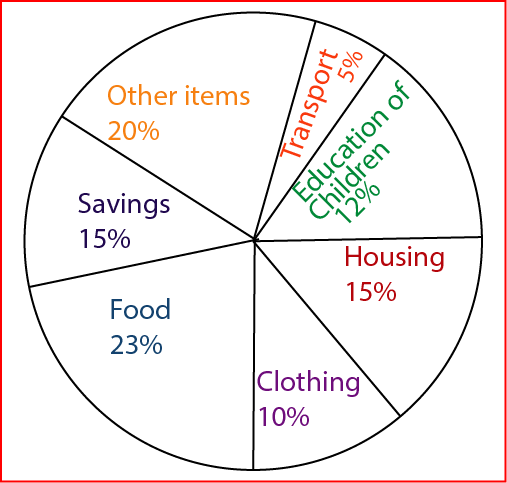
5Directions: The pie chart drawn below shows the expenses of a family on various items and its savings during the year 2001. Study the graph and answer the questions.
Percent of money spent on various items and savings by a family during 2001
Q:
परिवार का अधिकतम खर्चा चालू था
- 1बच्चों की शिक्षाfalse
- 2अन्य आइटमfalse
- 3भोजनtrue
- 4आवासfalse
- Show AnswerHide Answer
- Workspace