Join Examsbook
वर्ष के लिए परिवार की कुल बचत व्यय के बराबर थी
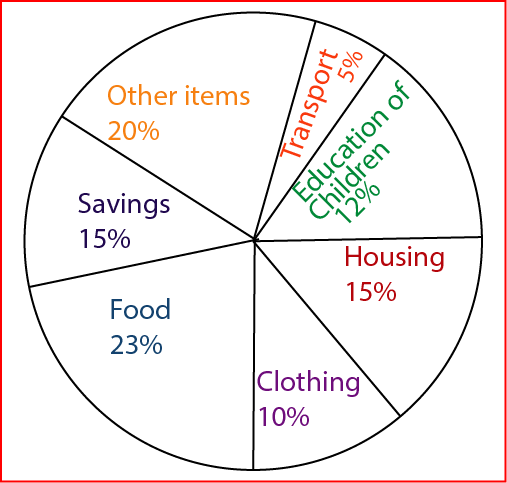
5Directions: The pie chart drawn below shows the expenses of a family on various items and its savings during the year 2001. Study the graph and answer the questions.
Percent of money spent on various items and savings by a family during 2001
Q:
वर्ष के लिए परिवार की कुल बचत व्यय के बराबर थी
- 1आवासtrue
- 2परिवहन सहित अन्य वस्तुएँfalse
- 3भोजनfalse
- 4वस्त्रfalse
- Show AnswerHide Answer
- Workspace