Join Examsbook
आय का कितना प्रतिशत परिवहन और अन्य वस्तुओं पर एक साथ खर्च किया गया था?
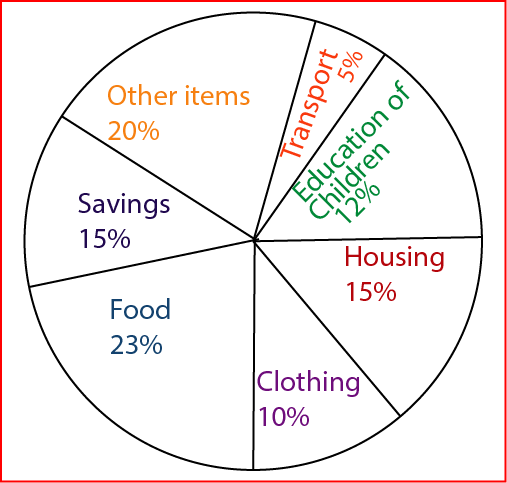
5Directions: The pie chart drawn below shows the expenses of a family on various items and its savings during the year 2001. Study the graph and answer the questions.
Percent of money spent on various items and savings by a family during 2001
Q:
आय का कितना प्रतिशत परिवहन और अन्य वस्तुओं पर एक साथ खर्च किया गया था?
- 130%false
- 232%false
- 325%true
- 420%false
- Show AnswerHide Answer
- Workspace